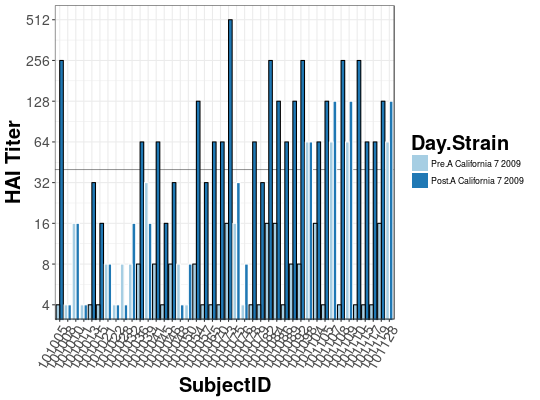
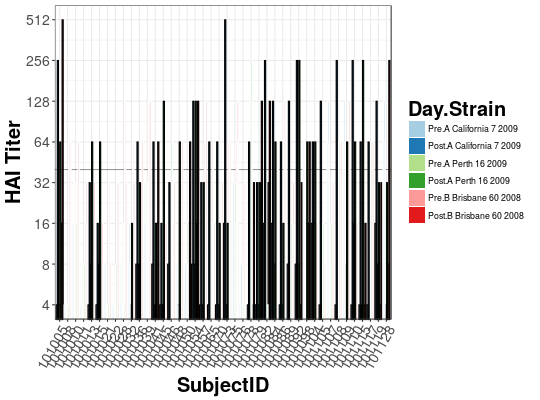
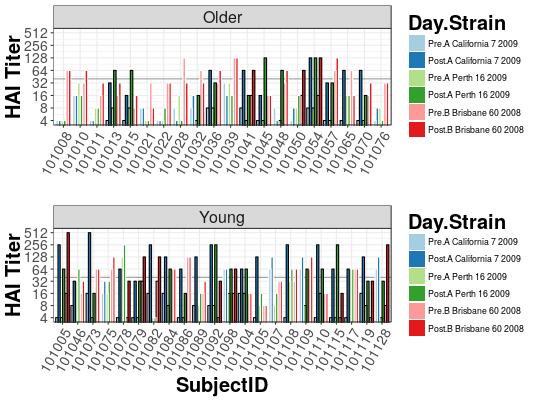
Titer bar plots.
Barplot plots the baseline and day 28 titers
Barplot(dat_list, subjectCol = "SubjectID", cols = 1, groupVar = NULL,
  colors = c("#A6CEE3", "#1F78B4", "#B2DF8A", "#33A02C", "#FB9A99", "#E31A1C",
  "#FDBF6F", "#FF7F00"))
Arguments
| dat_list | a named list like the one returned by |
|---|---|
| subjectCol | the name of the column specifying a subject ID. Default is "SubjectID". |
| cols | numeric specifying how many columns to layout plot |
| groupVar | an optional character string specifying a grouping variable. May be either a variable in |
| colors | a vector of colors specifying bar colors. If |
Value
(invisibly) a list of ggplot2 object(s).
Examples
#>#>## Bar plot of a single strain Barplot(titer_list["A California 7 2009"])## Bar plot of all 3 strains Barplot(titer_list)## Can improve readability of previous plot by separating into groups ## For example, group by AgeGroup Barplot(titer_list, groupVar = "AgeGroup")